New Data Visualization Capabilities in VDU CRIS
In June 2025, Vytautas Magnus University successfully implemented the latest version (8.1) of the open-source DSpace–CRIS software, which serves as the core platform for the University’s research information management system (VDU CRIS). One of the key new features of this version is an advanced data visualization tool, designed to support more effective analysis and presentation of academic activities.
Key visualization features in the new VDU CRIS version:
- Dynamic charts that update in real time;
- Users can:
- Filter data according to selected criteria (e.g., time period, document type, publication category, scientific field, full-text access rights, etc.);
- View detailed information – by clicking on a specific chart element, related data is displayed.
Visualizations are generated based on the selected research entity. The currently available visualization groups in VDU CRIS include:
- Publications:
- Visualized by document and publication type, date, country of publication, language, scientific field and subfield, Sustainable Development Goals (SDGs), indexed databases, and full-text access rights.
- Electronic Theses and Dissertations (ETDs):
- Visualized by thesis type, date, scientific and study field, study program, and access rights.
- Research data:
- Visualized by data type, date, country, language, scientific subfield, repositories and databases, and access rights.
- Projects:
- Visualized by project start date, scientific field, RDI result, RDI type, funding type and source, project scope, and economic sector.
Users can generate custom diagrams by applying filters and search criteria tailored to their individual needs and analytical goals.
How to generate visualizations in VDU CRIS?
- In the VDU CRIS (https://vdu.lt/cris) system, select the research entity of interest, such as:
- Publications
- Electronic Theses and Dissertations (ETD)
- Research Data
- Projects
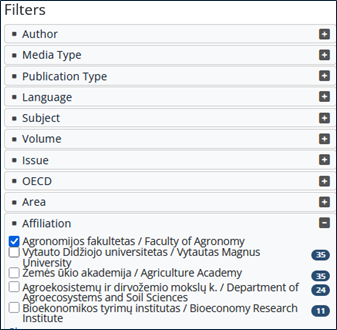
- Perform a search based on your selected criteria, for example: Publications of the Faculty of Agronomy in 2025.

- You can also select filters (on the left side of the window) to narrow down the search results.

- Click the “Show/Hide” button located above the list of search results — a list of available visualizations will appear at the top of the page.
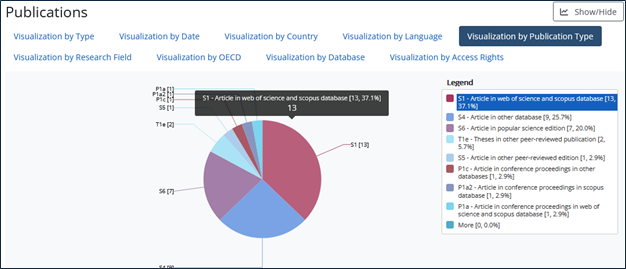
- Click on the link of the desired visualization, and the corresponding chart will be displayed — for example, a visualization of the Faculty of Agronomy’s 2025 publications by publication type.

- By clicking on any chart element of interest, a new chart will be generated, providing more detailed information about the selected element. Below the chart, a corresponding filtered list will be displayed. For example, if you click on the “Articles in Web of Science and Scopus databases” element in the publication type visualization, a new chart will appear along with a list of publications matching that criteria.
VDU CRIS visualizations are a powerful tool that enables users to visualize and analyze dynamic data, offering interactive exploration and supporting informed decision-making.


